
Struggling to turn raw data into a polished research report? You’re not alone. Many researchers collect valuable data but fail to present it effectively.
In this guide, you’ll learn how to convert raw data into a research report using AI tools quickly and efficiently. Whether you’re an academic writer, student, or researcher, this step-by-step process will help you transform messy datasets into structured, publishable insights.
Table of Contents
Understanding Raw Data and Research Reporting
What is Raw Data?
Raw data refers to unprocessed information collected from experiments, surveys, or databases. It often comes in formats like CSV files, spreadsheets, or logs.
Why Researchers Struggle with Reporting
- Data is complex and unstructured
- Time-consuming manual analysis
- Difficulty in academic writing and formatting
- Lack of clarity in interpretation
As highlighted in your document, even experienced researchers find it challenging to summarize multiple datasets manually .
Step 1: Collecting Reliable Primary Data
Best Free Data Sources
Here are trusted platforms to access raw datasets:
- Government databases (data.gov, data.gov.in)
- World Bank & UN datasets
- Kaggle datasets
- Harvard Dataverse
- WHO & CDC repositories
Choosing the Right Dataset
When selecting data, ensure:
- It aligns with your research objective
- It includes documentation (methodology, glossary)
- It is recent and credible
Step 2: Analyzing Raw Data Using AI
How AI Simplifies Data Analysis
AI tools can process large datasets in minutes, saving days of manual work. They can:
- Identify trends and patterns
- Summarize datasets
- Generate structured reports
Example Prompt for Analysis
Use a prompt like:
“Analyze this dataset and convert it into a meaningful research report with insights and conclusions.”
This approach, as demonstrated in your document, can produce a complete draft report in minutes.
Step 3: Structuring the Research Report
Common Research Report Formats
- IMRAD (Introduction, Methods, Results, Discussion)
- Technical report
- White paper
- Policy brief
- Academic thesis
Choosing the Right Format
For data-heavy studies, a technical report format is often ideal because:
- It supports detailed analysis
- It allows flexible structure
- It suits institutional and applied research
Step 4: Enhancing the Report with Insights
Adding Contextual Analysis
Improve your report by connecting findings with:
- Public health guidelines
- Industry standards
- Existing research
Advanced Data Interpretation Ideas
Consider adding:
- Comparative analysis
- Effectiveness summaries
- Cost-efficiency ratios
- Heatmaps and visual analytics
- Implementation frameworks
These enhancements significantly increase the value and credibility of your report.
Step 5: Making the Report Visually Engaging
Visual Frameworks and Charts
A strong research report includes:
- Graphs and charts
- Infographics
- Data visualizations
Improving Readability and Impact
- Use headings and bullet points
- Add summaries for each section
- Include visual supplements
A visually appealing framework can make your research more persuasive and easier to understand.

Benefits of Using AI for Research Writing
Using AI in research reporting offers:
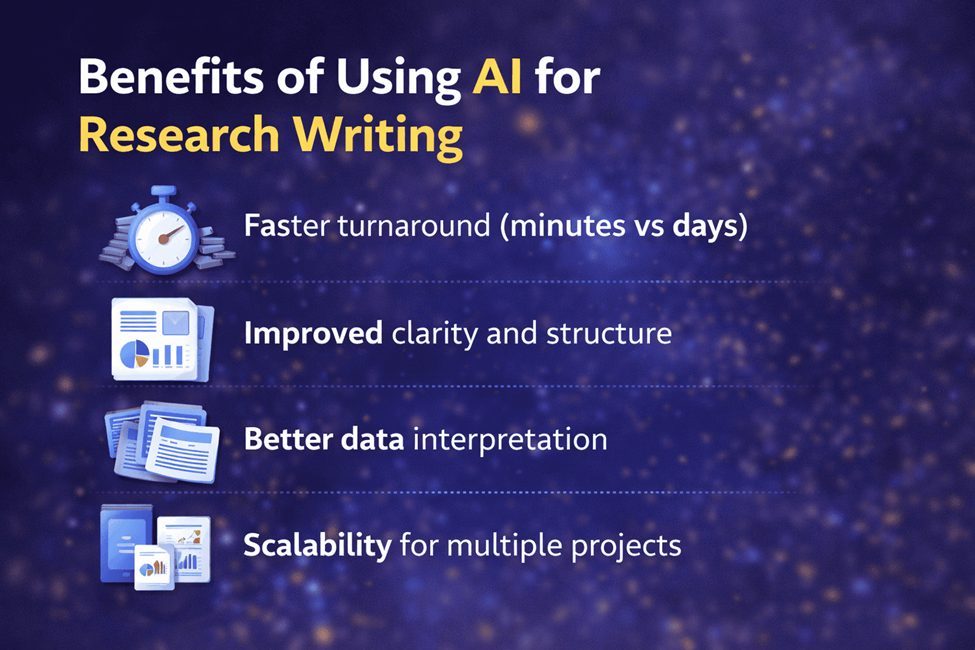
- Faster turnaround (minutes vs. days)
- Improved clarity and structure
- Better data interpretation
- Scalability for multiple projects
Key Takeaway: AI doesn’t replace researchers—it amplifies their productivity and impact.


 Allow notifications