
Struggling to turn raw data into a polished research report? You’re not alone. Many researchers collect valuable data but fail to present it effectively. Whether you’re an academic writer, student, or researcher, this step-by-step process will help you transform messy datasets into structured, publishable insights.
Table of Contents
Understanding Raw Data and Research Reporting
What is Raw Data?
Raw data refers to unprocessed information collected from experiments, surveys, or databases. It often comes in formats like CSV files, spreadsheets, or logs.
Where to find Raw Data?
There are many websites which will give you access to raw data. I am listing a few here:
- https://data.gov : Massive repository of US government data across all domains.
- https://data.gov.in : Public datasets from Indian ministries on health, agriculture, education, etc.
- https://data.europa.eu/en : Datasets from all EU institutions and member states.
- https://data.worldbank.org : Global economic, education, development, and poverty statistics.
- https://data.un.org : The United Nations’ gateway to development and social statistics.
- CDC data & statistics: https://www.cdc.gov/datastatistics/index.html
- WHO Global Health Observatory: https://www.who.int/data/gho
- NIH National Library of Medicines: https://www.nlm.nih.gov/databases/download.html
- https://ourworldindata.org : High-quality, ready-to-use CSV datasets on health, environment, energy, etc.
- https://www.icpsr.umich.edu/web/pages/ICPSR/ : Select datasets are freely available (look for “openICPSR”).
- https://dataverse.harvard.edu/ : Academic datasets across disciplines; most available without registration.
- https://www.kaggle.com/datasets : Good for practice and applied analysis; requires only Google login (optional for browsing).
- NASA EarthData: https://earthdata.nasa.gov
- USDA Open Data Catalog: https://data.nal.usda.gov/
- https://www.fao.org/faostat/en/ : Food production, agriculture, trade data from over 200 countries.
Choosing the Right Dataset
When selecting data, ensure:
- It aligns with your research objective
- It includes documentation (methodology, glossary)
- It is recent and credible
Assume I opened ICPSR and extracted some primary data from a study conducted by the US Department of Health and Human Services, the Centers for Disease Control and Prevention, and the National Institute of Occupational Safety and Health titled “Efficacy of Do-It-Yourself Air Filtration Units in Reducing Exposure to Simulated Respiratory Aerosols.”
On June 10, 2025, the information was posted on the website (see this list).
Step 1: Analysing the data and making the draft report
I will use a simple Gen AI tool called Claude.ai for this
Prompt: I am sharing with you raw data concerning a research: Efficacy of Do-It-Yourself Air Filtration Units in Reducing Exposure to Simulated Respiratory Aerosols. Principal Investigator(s): United States Department of Health and Human Services. Centers for Disease Control and Prevention. National Institute of Occupational Safety and Health. Can you analyse it all and turn it into a meaningful research report?
Upload all the files containing the primary data in Claude along with the prompt.
Check out the report Claude produced for me in less than 3 minutes: https://drive.google.com/file/d/162r0kX8FBmb3fa222s0MNiW0-9izz8wn/view?usp=sharing
Step 2: Putting it in the right format
As you are aware, there are specific formats and methods for preparing research papers. Therefore, we must ensure that our report adheres to the proper format.
If you are not familiar with the different types of structures, give claude this prompt:
“What are the many styles / structures of preparing research reports? Which one will be the most appropriate for this one and why?”
Hers is the list of styles/structures Claude will generate:
- IMRAD Format (Introduction, Methods, Results, And Discussion)
- Technical report format
- Policy brief format
- White paper format
- Academic thesis format
- Conference paper format
Claude will also suggest that the most appropriate structure for this particular study would be the technical report format properly explaining why so and sharing details about why not the other formats.
Now ask claude: Can you make the report in technical report format for me?
This is what Claude will produce:

https://drive.google.com/file/d/1hAVIHA7syiASnoKtIyvF-K4aQJfSIvF_/view?usp=sharing
Step 3: Check what is missing, what can be added
At this point, you have a well-prepared report, but you want it to be better. You want to check if there are some important sections which can be added in the report. Ask Claude to do it for you by giving this prompt:
Am I missing something? Do you think there are important sections we can add to the report? What about some more contextualisation – maybe a section showing how these findings align with or support existing public health or air quality guidelines (CDC, WHO, EPA, etc)? What about including some advanced data interpretations such as comparative, effectiveness summary, cost-efficiency ratio, heatmaps, etc? Can we add some implementation playbooks (annexures)? I can be wrong with my suggestions. I am seeking your help here. You have to think hard and take a call. You are free to accept or reject my suggestions. If there is any doubt, you can ask me
Here’s the final version of the research report: https://drive.google.com/file/d/1KanMvN1fCHVbJY1ktjiX4huU82DiPrxa/view?usp=sharing
If you also want the report to be more engaging and want people to see the research that has gone behind it preferably in a visually appealing way then tell Claude:
“Can you please generate a visually appealing framework to back the proposal”
This is what Claude generated for me:
https://claude.ai/public/artifacts/583518b5-30ff-4d4d-82eb-04c156710f14
This visual document can now supplement my main report.
Benefits of Using AI for Research Writing
Using AI in research reporting offers:
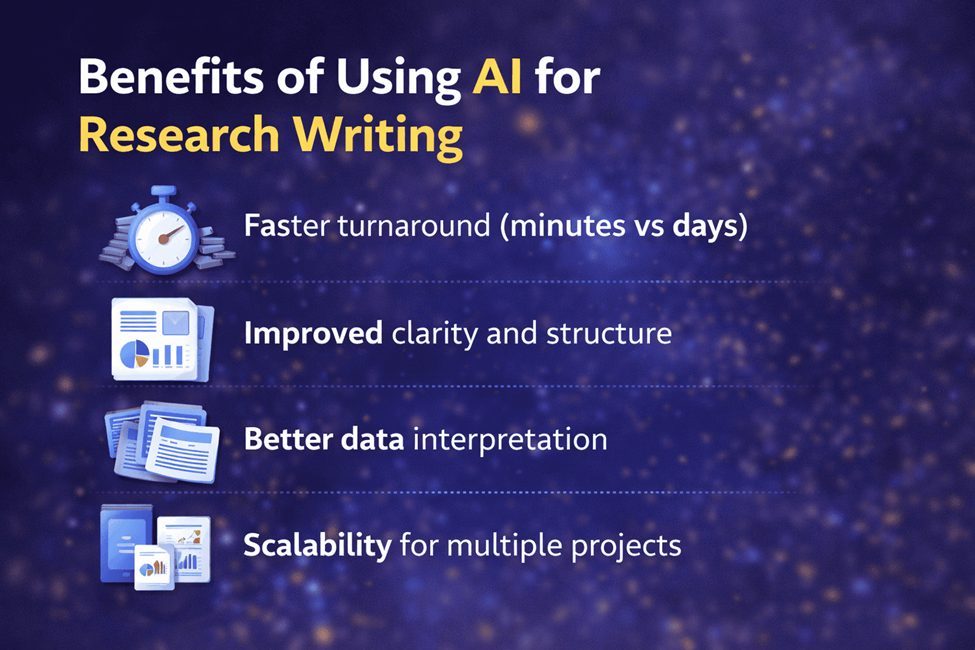
- Faster turnaround (minutes vs. days)
- Improved clarity and structure
- Better data interpretation
- Scalability for multiple projects
Key Takeaway: AI doesn’t replace researchers—it amplifies their productivity and impact.


 Allow notifications